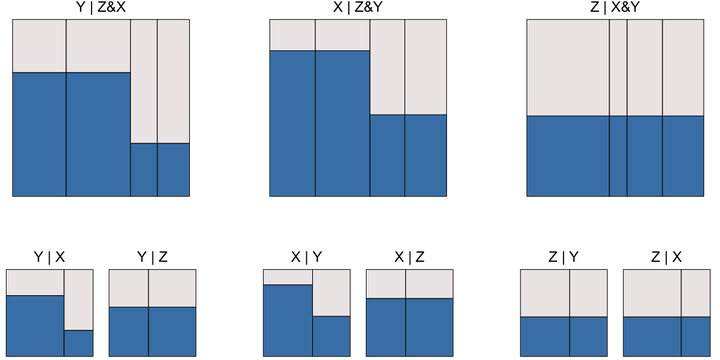
An eikosogram (ancient Greek for probability picture) divides the unit square into rectangular regions whose areas, sides, and widths, represent various probabilities associated with the values of one or more categorical variates. Rectangle areas are joint probabilities, widths are always marginal (though possibly joint margins, i.e. marginal joint distributions of two or more variates), and heights of rectangles are always conditional probabilities. Eikosograms embed the rules of probability and are useful for introducing elementary probability theory, including axioms, marginal, conditional, and joint probabilities, and their relationships (including Bayes theorem as a completely trivial consequence).
Eikosograms
 R. Wayne Oldford
R. Wayne Oldford
Professor of Statistics
My research interests include data visualization, exploratory data analysis, and interactive high dimensional data analysis.