Visualizing dependence in high-dimensional data. An application to S&P 500 constituent data
Abstract
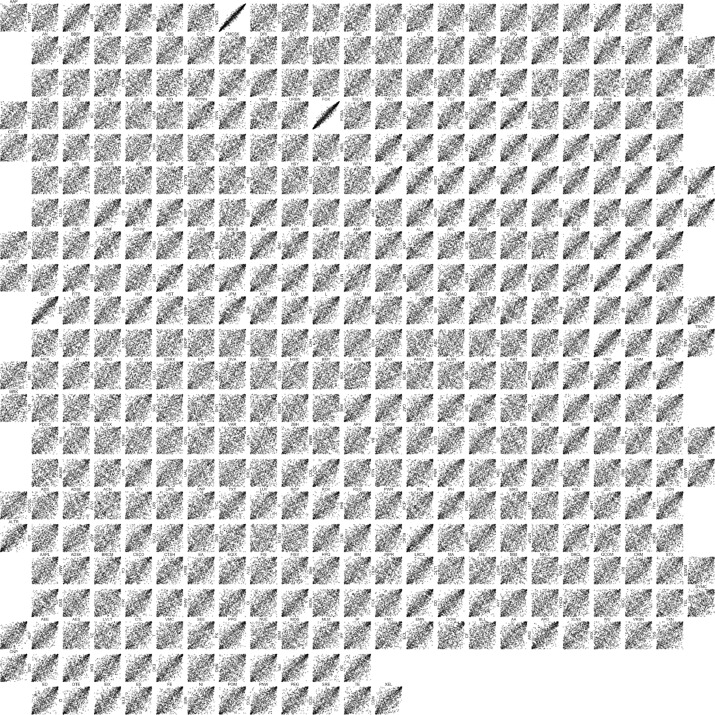
The notion of a zenpath and a zenplot is introduced to search and detect dependence in high-dimensional data for model building and statistical inference. By using any measure of dependence between two random variables (such as correlation, Spearman’s rho, Kendall’s tau, tail dependence etc.), a zenpath can construct paths through pairs of variables in different ways, which can then be laid out and displayed by a zenplot. The approach is illustrated by investigating tail dependence and model fit in constituent data of the S&P 500 during the financial crisis of 2007–2008. The corresponding Global Industry Classification Standard (GICS) sector information is also addressed. Zenpaths and zenplots are useful tools for exploring dependence in high-dimensional data, for example, from the realm of finance, insurance and quantitative risk management. All presented algorithms are implemented using the R package zenplots and all examples and graphics in the paper can be reproduced using the accompanying demo SP500.