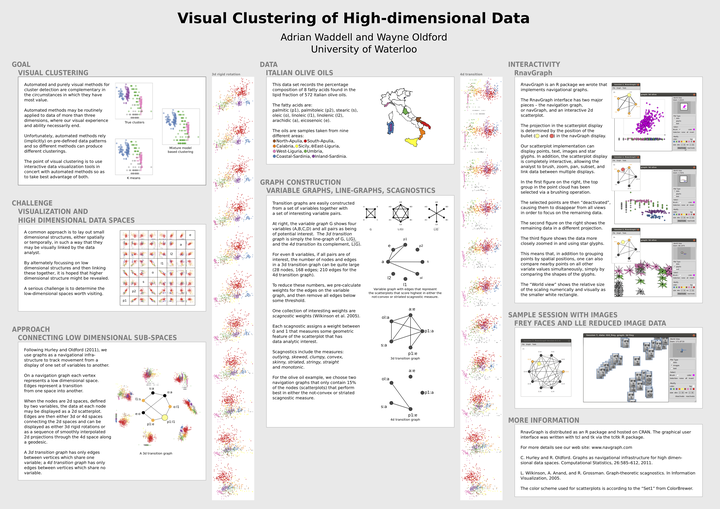
Interactive Visual Clustering of High Dimensional Data by Exploring Low-Dimensional Subspaces

Abstract
The structure of a set of high dimensional data objects (e.g. images, documents, molecules, genetic expressions, etc.) is notoriously difficult to visualize. In contrast, lower dimensional structures (esp. 3 or fewer dimensions) are natural to us and easy to visualize. A not unreasonable approach then is to explore one low dimensional visualization after another in the hope that together these will shed light on the higher dimensional structure. In our poster, we describe the graph theoretic structure recently proposed in Hurley and Oldford (2011) that represents low-dimensional spaces as graph nodes and transitions between spaces as edges. Of interest are walks along these graphs that reveal meaningful structure. If the nodes are two dimensional and edges exist, say, only between 2d spaces which share a variate, then the walk could be represented dynamically as a series of scatterplots, one transitioning into the next via a 3d rigid transformation. We demonstrate how these graphs are constructed and dynamically explored via our open source R package, RnavGraph.