Abstract
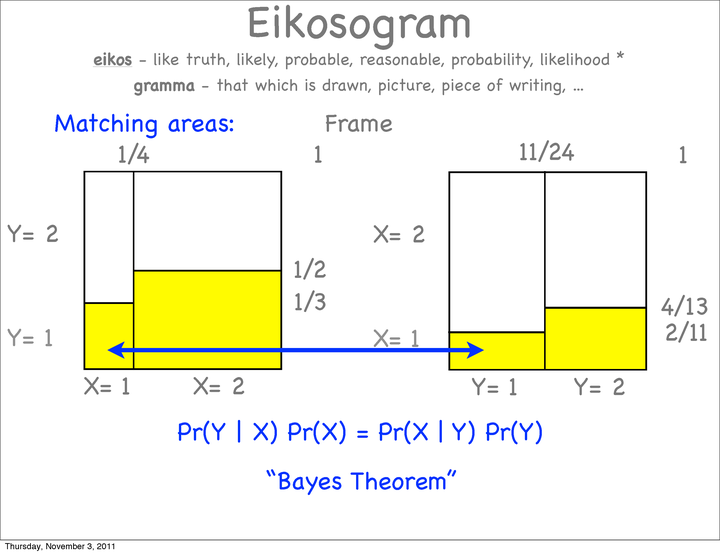
Good diagrams clarify. Very good diagrams force the ideas upon the viewer. The best diagrams compellingly embody the ideas themselves. An eikosogram, or probability picture, is a simple and easily constructed figure that ostensively defines probability. It embeds the rules of probability – conditional, joint and marginal – within its construction. As a simple ostensive definition, the eikosogram is a natural tool to formally introduce probability theory to students. This will be demonstrated in the talk, along with how the eikosogram can be used to visually ground seemingly abstract concepts such as conditional independence. Some classical probability puzzles/paradoxes will be used as illustration.
R. Wayne Oldford
Professor of Statistics
My research interests include data visualization, exploratory data analysis, and interactive high dimensional data analysis.